4.1 Getting started
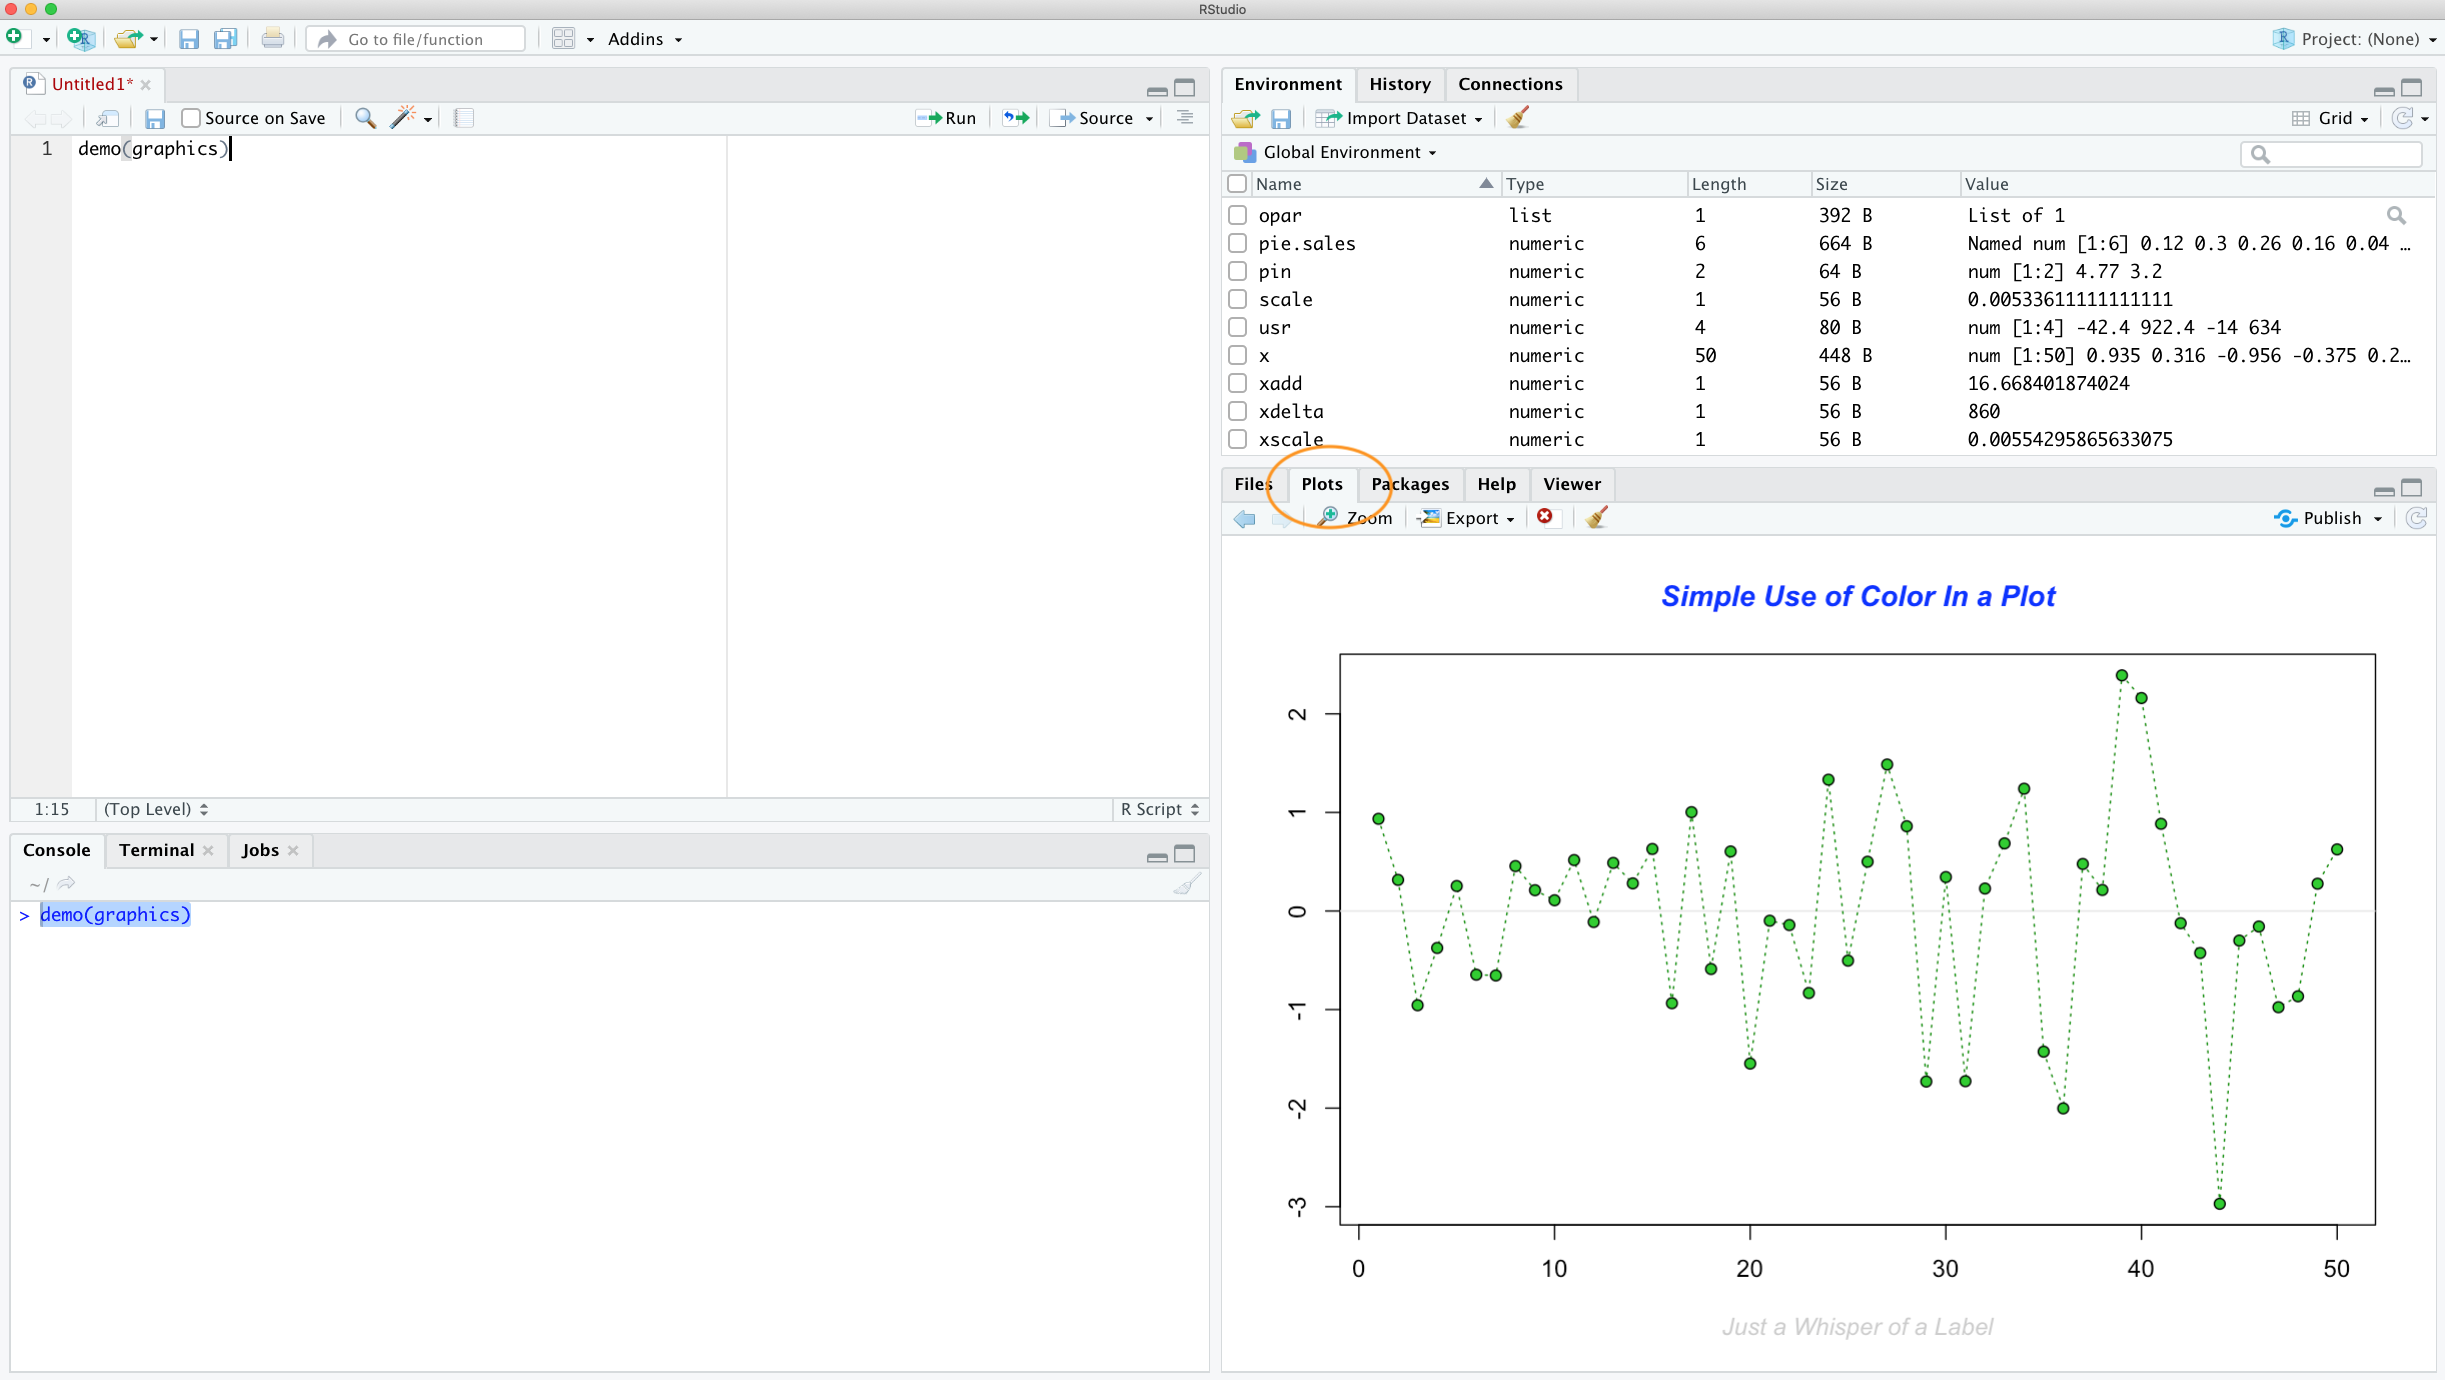
When you create a plot in RStudio the plot will be displayed in the ‘Plots’ tab by default which is usually located in the bottom right pane in RStudio.
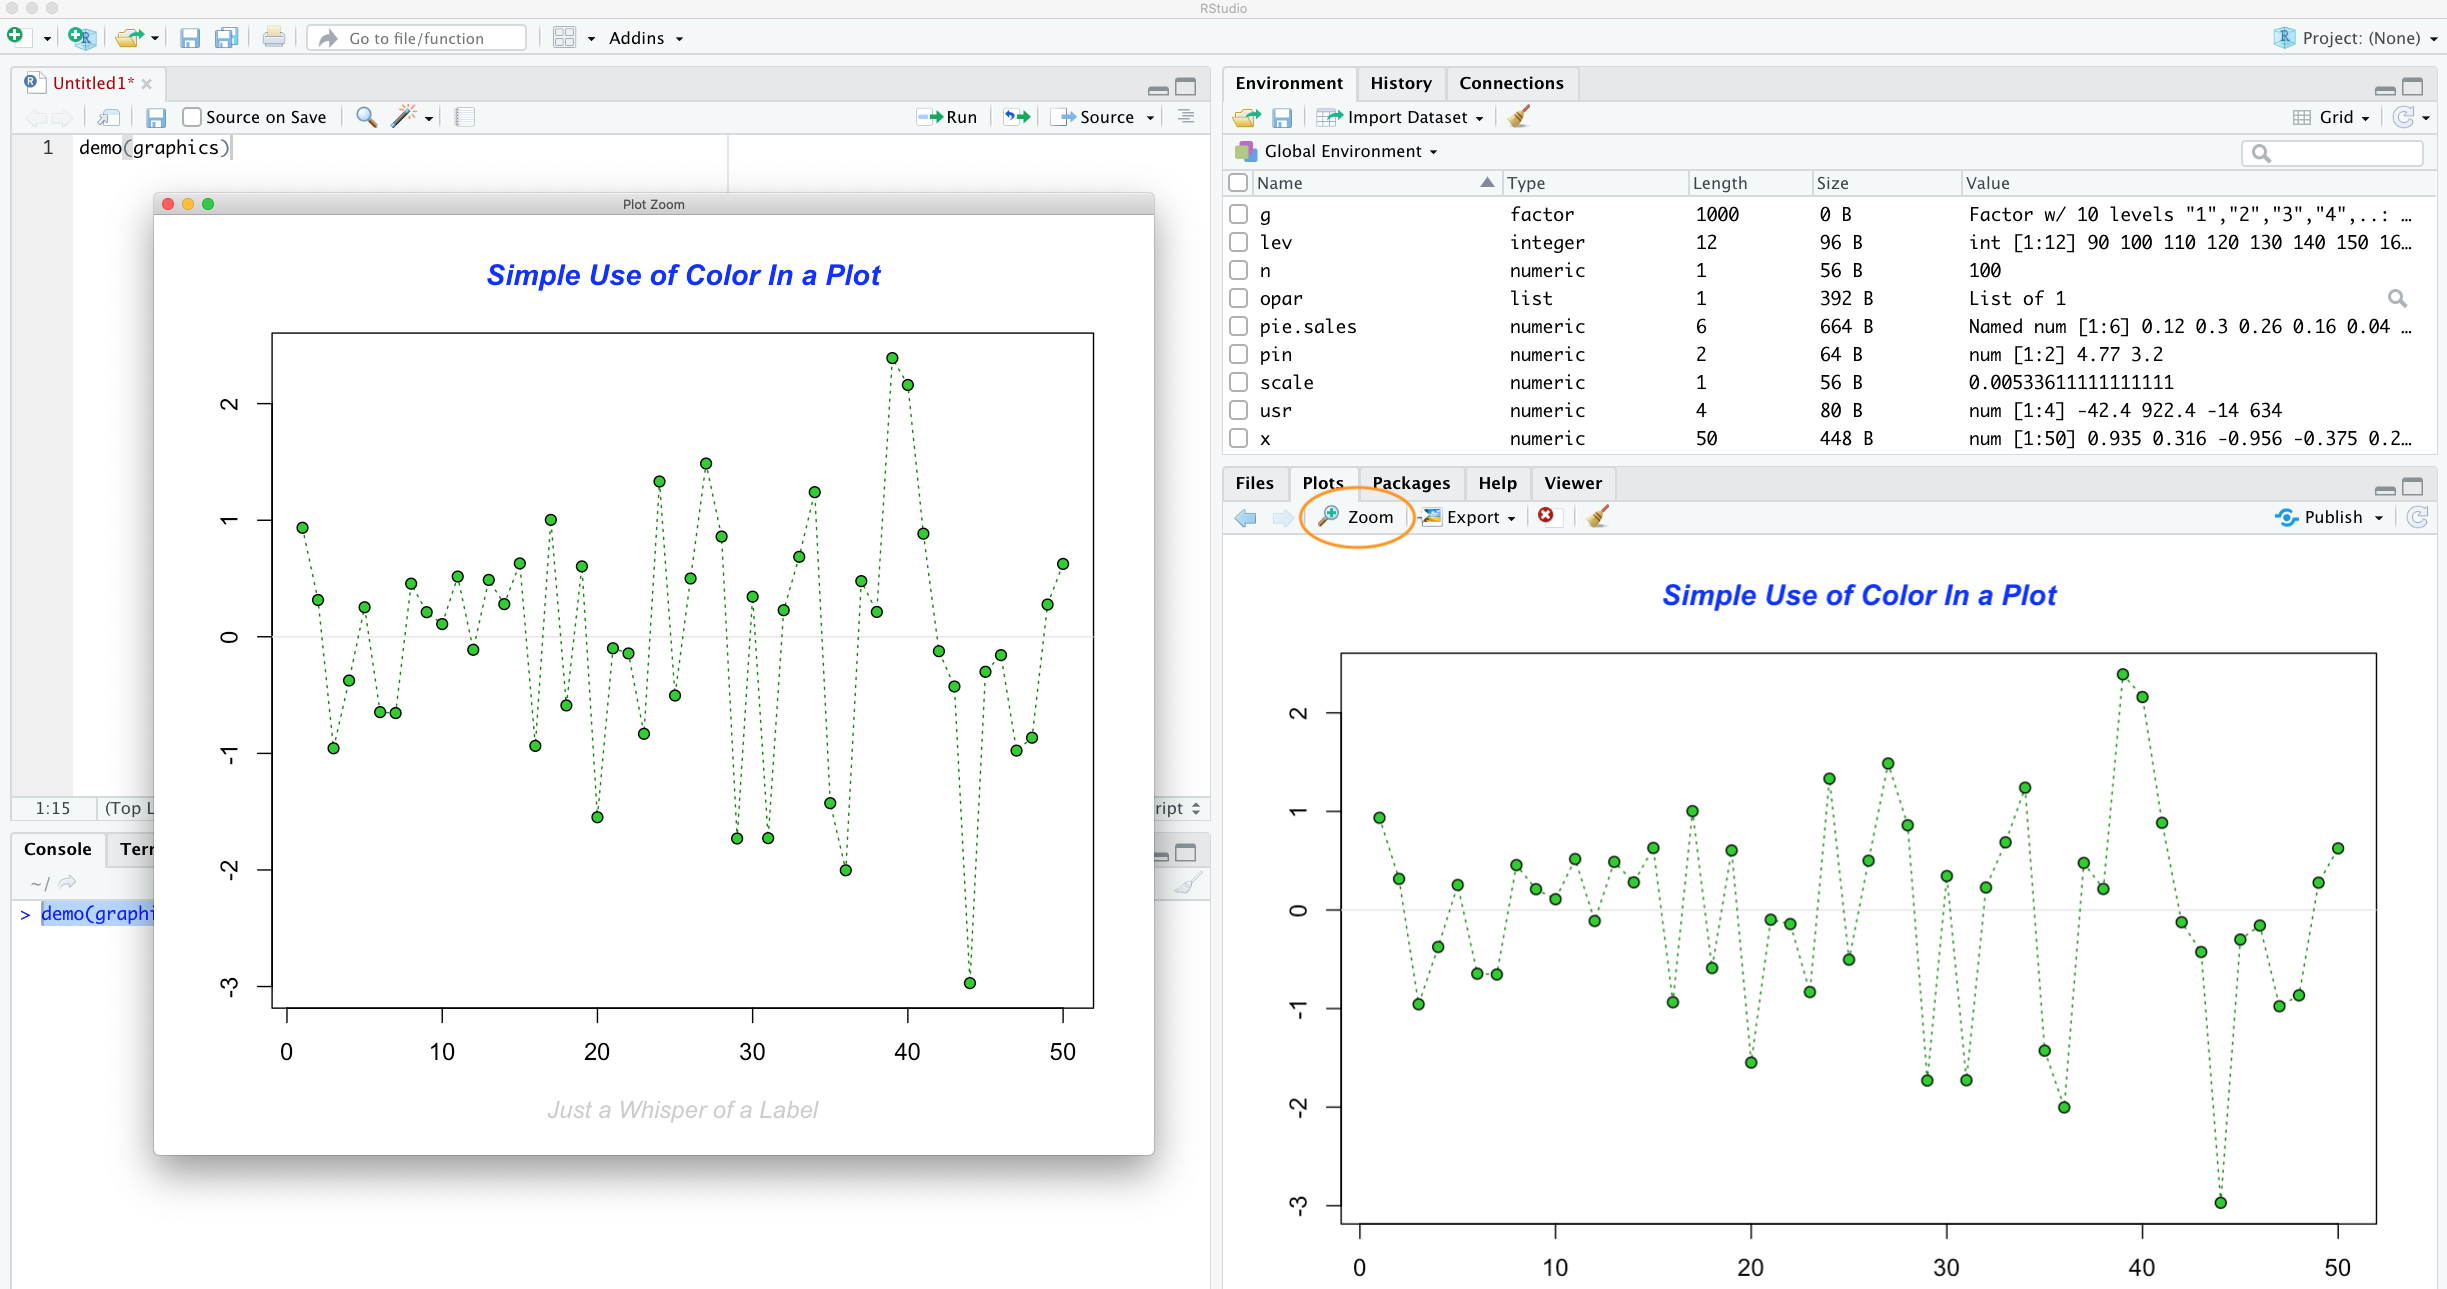
You can zoom in on a plot by clicking the ‘Zoom’ button which will display your plot in a separate window. This can be really useful if you have a particularly large or complex plot (we’ve noticed that RStudio sometimes fails to display a plot if it’s ‘big’). You can also scroll through plots you’ve previously created by clicking on one of the ‘arrow’ buttons.
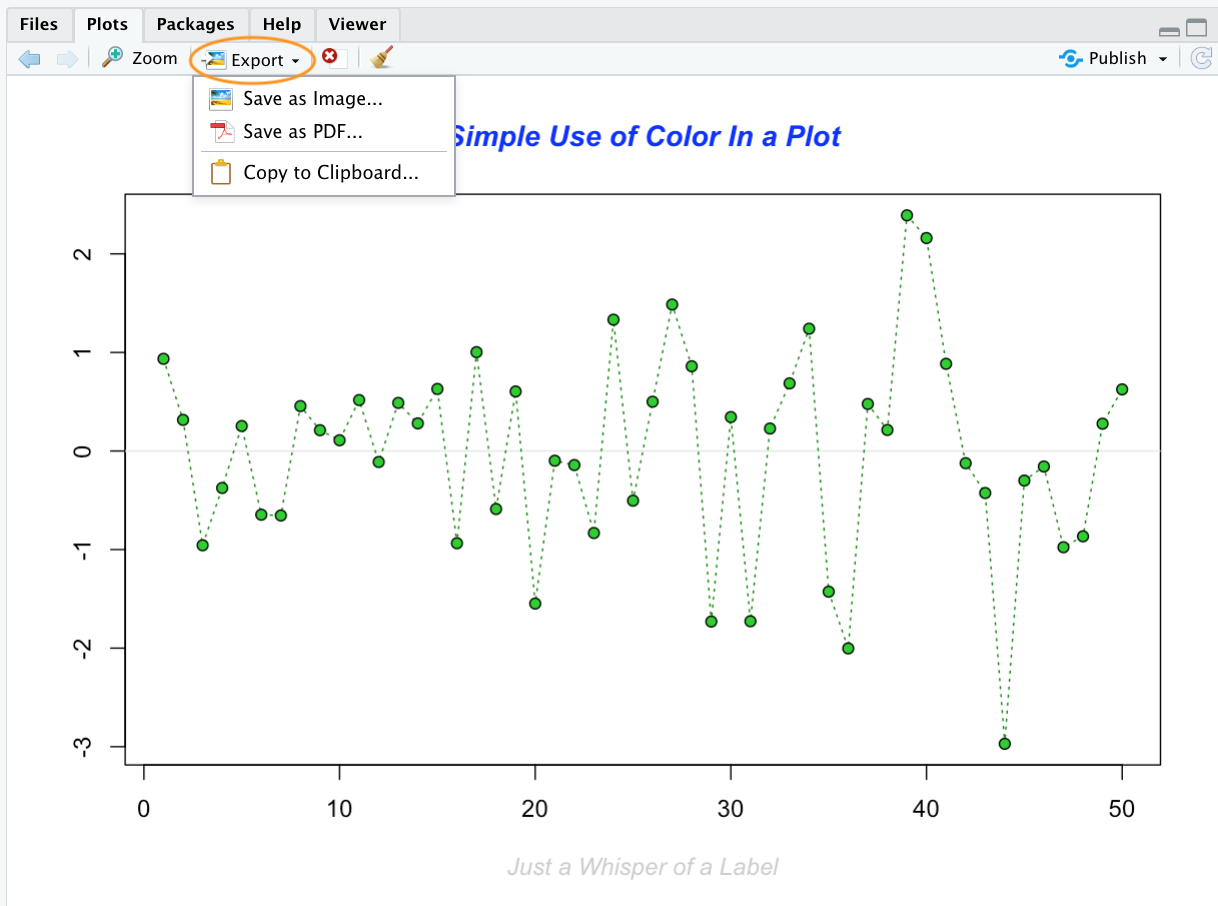
Plots can also be saved in a variety of formats (pdf, png, tiff, jpeg etc) by clicking on the ‘Export’ button and selecting your desired format. You can also redirect your plots to an external file using R code which we’ll cover later in this Chapter.